
Tips for Calculating Margins in the B2B Auto Trade

Margin calculation in the B2B automotive trade describes the systematic process by which dealers align purchasing costs, reconditioning expenses, inventory holding periods, and selling prices in such a way that a predictable gross profit is generated per vehicle and the overall profitability of the inventory is ensured. Those who do not master this process lose money without even realizing it.
This guide explains which factors are currently putting pressure on the margins of European B2B retailers, how to develop practical cost calculation models, and which strategies can sustainably protect earnings per vehicle. From full-cost accounting to dynamic pricing and ongoing margin monitoring: Each section provides concrete strategies you can implement right away.
What is currently putting pressure on margins in the European B2B used-car market?
Profitability in the B2B automotive retail sector has changed significantly over the past two years. Several factors are simultaneously affecting margins, and none of them can be considered in isolation.
Supply Shifts and Price Volatility in the Used Car Market
The cycles for lease returns have shifted. Fewer new vehicles were leased during the pandemic, so fewer recent used cars are now entering the market. At the same time, a growing supply of used electric vehicles is putting downward pressure on prices in this segment. (McKinsey and Company) estimates that used-car prices in several European countries have fallen by about 20 percent since the end of 2022; the price index for electric vehicles plummeted by up to 34 percent—twice as much as the overall market.
This volatility makes any calculation less reliable. Anyone who buys a vehicle and wants to sell it four weeks later at the planned price must expect that the market price may have fallen in the meantime. This is especially true for BEVs: The depreciation rate after three years averages 51 percent, compared to 31 percent for internal combustion engine vehicles (Gautam, Pode, Pode, Ayetor, Diouf (Vehicles, MDPI)).
Regulatory pressure and rising operating costs
CO₂ fleet limits, expanded low-emission zones, and stricter documentation requirements act as hidden margin killers. Compliance costs aren’t always reflected in a separate line item in vehicle cost calculations, but they add up: registration fees, certificates, expert reports, and the administrative burden of cross-border trade. Dealers operating in multiple markets, in particular, face friction losses due to differing regulatory requirements from country to country.
Increased Competition Due to Digital B2B Platforms
Price transparency in the wholesale market has increased significantly for dealers thanks to digital car marketplaces. Buyers can compare offers from multiple countries in seconds, which narrows the room for negotiation. In 2025, 66 percent of car buyers considered both new and used vehicles when making a purchase, up from 57 percent the previous year (Cox Automotive). This increases competitive pressure on both sides of the market.
Online transactions in the European used-car market are growing at a CAGR of 16.35 percent through 2031, while the offline channel will still hold 87.35 percent of the market share in 2025 (Mordor Intelligence). This shows that digitalization is accelerating, and those who do not adjust their business plans accordingly will lose ground.
How is a sound margin calculation structured in the B2B auto trade?
Many retailers still use the simple formula: selling price minus purchase price. That’s not enough. A robust cost calculation takes into account every cost item that arises between purchase and delivery.
Purchase price, processing costs, and service life as the basis for cost calculation
The full-cost approach is the basis of any reliable margin calculation. It includes:
Purchase price, including shipping costs and, if applicable, delivery charges
Service: Smart Repair, Wear Parts, Professional Vehicle Detailing, HU/AU
Stand costs: Space rental, capital commitment costs, insurance (pro-rated per day)
Marketing costs: Listing fees, platform fees, photography services
Warranty reserve: 200 to 400 euros per vehicle as a buffer
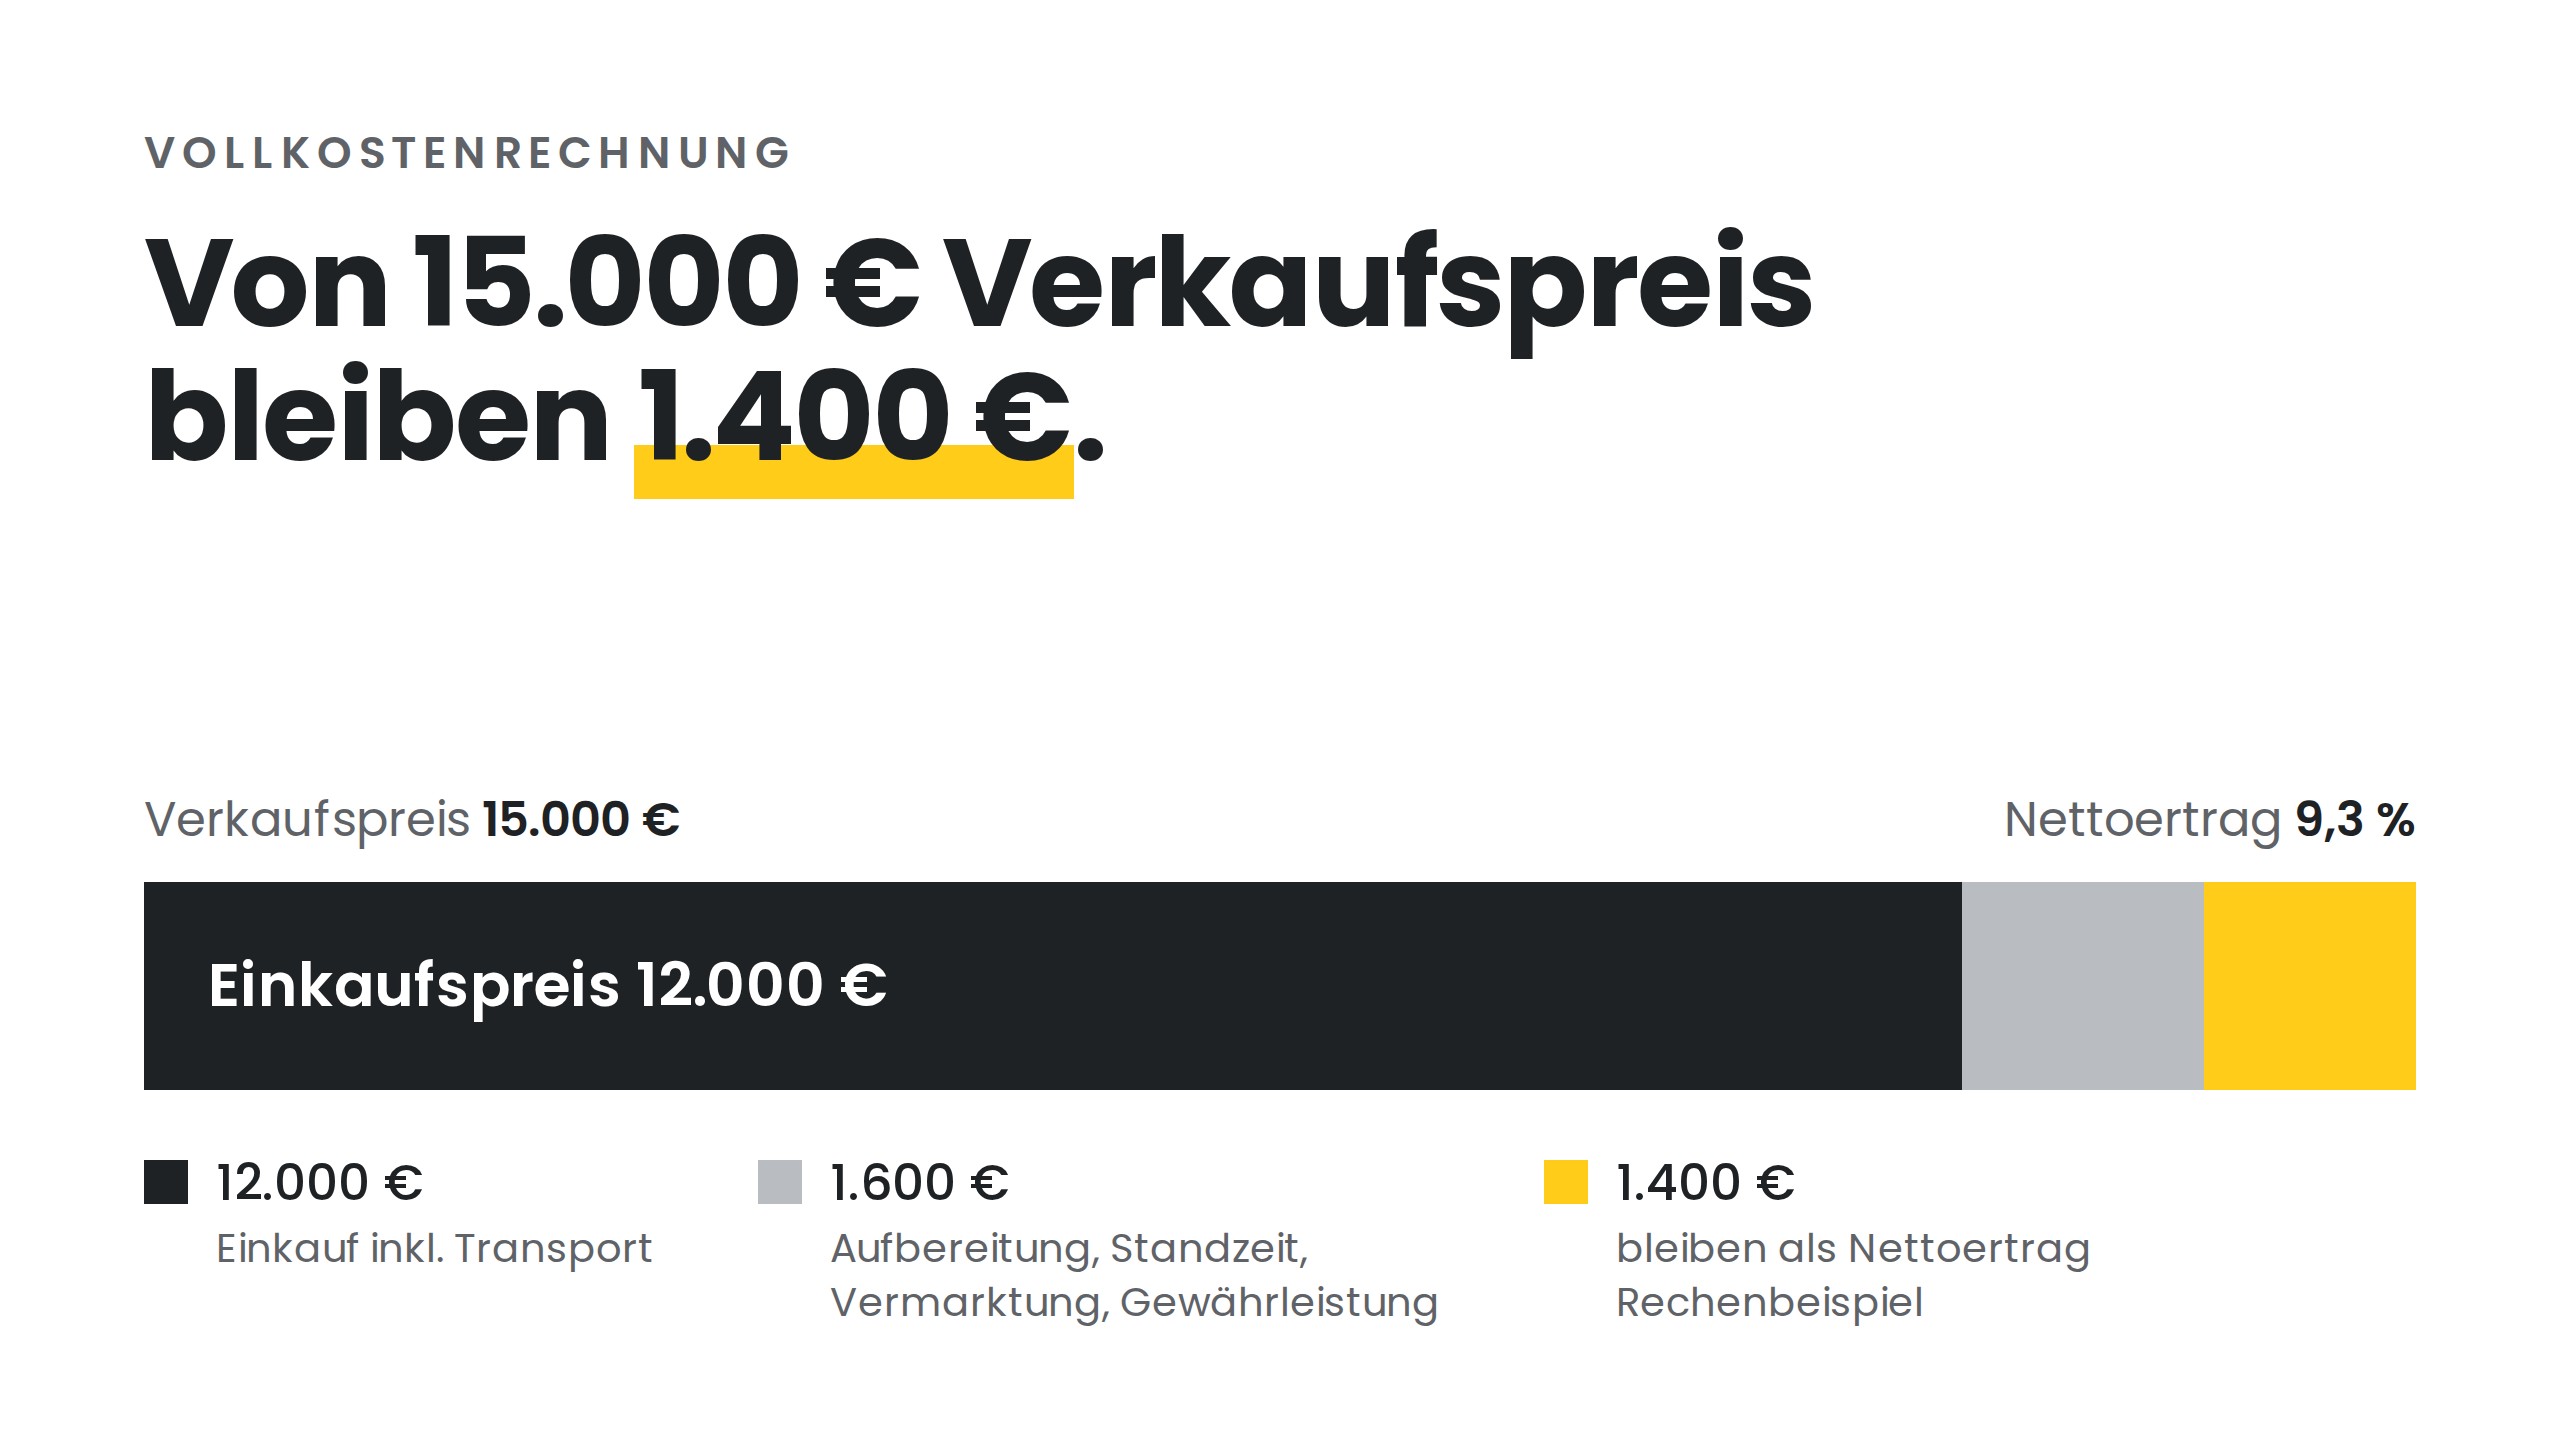
Let's run the numbers. A vehicle is purchased for 12,000 euros and sold for 15,000 euros. On paper, that's a gross margin of 3,000 euros—or 20 percent of the selling price.
In addition, until the handover:
Reconditioning (Basis package): 400 euros
Booth rental fee for 30 days: 900 euros
Marketing, listing, and photos: 100 euros
Warranty reserve: 200 euros
The total actual costs thus amount to 13,600 euros. The gross profit is 1,400 euros, which is 9.3 percent of the selling price. Depending on the level of processing and the location, total costs range between 13,200 and 13,800 euros, resulting in a net profit of between 12 and 8 percent. So, the supposed 20-percent margin amounts to just over half of that in the best-case scenario, and 40 percent of it in the worst-case scenario.
Differential Taxation vs. Standard Taxation in a B2B Context
The tax option chosen has a significant impact on the actual margin. Under the differential taxation method specified in Section 25a of the German Value-Added Tax Act (UStG), value-added tax is calculated only on the difference between the purchase price and the selling price. This is particularly advantageous for vehicles purchased from private individuals or other dealers subject to differential taxation, since no input tax credit is available in those cases.
In B2B online auctions, transactions are often subject to standard taxation. In this case, input tax credits apply, and calculations must be based on net prices. It is crucial that you correctly apply the tax treatment for each vehicle and do not mix gross and net amounts in your calculations.
Definition of Target Margins by Vehicle Segment
Broad targets such as “a 10 percent margin on everything” are unrealistic. The gross margin varies significantly depending on the segment:
Small cars priced up to 10,000 euros: 8 to 15 percent gross margin, high turnover
Mid-range (10,000 to 25,000 euros): 6 to 12 percent, balanced ratio
Premium (starting at 25,000 euros): 5 to 10 percent, higher absolute margin, longer service life
Define segment-specific targets and adjust them quarterly based on market conditions. This will help you identify early on which segments are seeing a decline in revenue.
What strategies help protect profit margins in the wholesale used-car business?
Margin protection starts with purchasing, not with sales. Three strategies directly contribute to gross profit.
Procurement Optimization Through Data-Driven Vehicle Evaluation
The purchase price is the most effective lever. If you overpay by 300 euros at the time of purchase, you’ll rarely recoup that amount when you sell. Standardized valuation processes prevent systematic overpayment. A structured condition report with clearly defined checkpoints provides the Basis for well-informed price negotiations.
Standardized evaluations with over 110 checkpoints (COSCheck) significantly increase transparency in the purchasing process. In a 2024–2025 survey of more than 160 car dealers, BCG found that AI-powered tools have become indispensable for pricing strategies and purchasing decisions (Boston Consulting Group).
Specifically, this means: Before you purchase a vehicle on a residual value marketplace or in an online auction, compare the asking price with current market data. Use multiple price sources, not just one.
Actively Manage Service Life and Define Depreciation Rules
Any vehicle that sits idle for too long costs money. Days in inventory and holding costs are among the biggest margin killers. According to AutoScout24 data, the average time a used car spent in inventory in Q4 2025 was 59 days, with inventory levels about 4 percent higher than the previous year (AutoScout24).
Define clear escalation levels:
Days 1 through 30: List the vehicle at the target price
Days 31 through 45: Reduce the price by 3 to 5 percent
Days 46 through 60: Second reduction; explore alternative sales channels
Starting on Day 61: Initiate immediate sale or wholesale distribution
These rules must be binding. Anyone who “falls in love” with a vehicle and waits for the perfect price ties up capital that could be put to better use elsewhere.
Streamline processing procedures and cap costs
Post-processing must not be an open item. Define standard packages with fixed budgets: for example, 400 euros for the " Basis" post-processing package and 800 euros for the Premium package. Anything above these amounts must be approved on a case-by-case basis.
A vehicle that requires 1,500 euros in reconditioning costs but for which the market yields only an 800-euro margin belongs directly in the wholesale market. This decision is easier to make when reconditioning budgets are defined in advance.
How does dynamic pricing work in the B2B automotive trade?
Static pricing models based on the “30-60-90 days” scheme are a thing of the past. In a market with real-time price transparency, you need more flexible approaches.
Use Real-Time Market Data
Dynamic pricing is based on the analysis of current transaction data, not on gut feelings. AI-powered pricing algorithms, such as those used on B2B trading platforms, deliver a data-driven market price within seconds. CarOnSale’s real-time pricing algorithm processes market data from its own transaction network and provides a data-driven price benchmark in seconds.
The advantage: You can immediately tell whether a vehicle is priced below or above market value. And you can adjust your pricing strategy to reflect current supply and demand conditions, rather than relying on outdated figures.
Automate price adjustments throughout the product's lifecycle
Rule-based pricing curves replace manual, ad hoc discounts. The logic is this: The longer a vehicle sits, the more expensive it becomes (tied-up capital, depreciation, parking space). Therefore, the price must decrease systematically to avoid exceeding the break-even point.
In practice, this means: Set up a pricing curve for each vehicle segment that automatically triggers adjustments. This removes the emotional element and makes the process repeatable.
What role do digital tools play in margin optimization?
Technology is a tool, not an end in itself. What matters is which features actually contribute to the margin.
A Comparison of B2B Trading Platforms and Evaluation Tools
Not every platform has the same impact on margins. The key features are:
Data-Driven Pricing: Algorithmic Market Prices Instead of Manual Estimates
Standardized Condition Reports: A Comparable Basis for Evaluation for Every Purchase
Transparent Cost Structure: Predictable Fees Instead of Hidden Costs
Exclusive Inventory: Access to vehicles that aren't listed on five platforms at the same time
At CarOnSale, for example, over 85 percent of the inventory is available exclusively on the platform, which makes it difficult for competitors to directly compare prices and gives buyers room to negotiate. The seller’s fee is 119 euros per vehicle successfully sold, with no subscription or upfront costs. This is a predictable item in margin calculations.
In an environment where the unorganized sales channel (private sales and informal trade) will still account for 54.60 percent of the European used-car market in 2025, professional used-car dealers offer a clear structural advantage through organized channels. This organized channel is growing at a CAGR of 6.18 percent.
Process Digitization from Purchasing to Delivery
Media transitions are hidden sources of costs. Every transition between systems (DMS, ads, Excel, phone) costs time, leads to errors, and reduces margins. A seamless digital process—from purchasing through evaluation to delivery—eliminates these inefficiencies.
Specifically: When a dealer connects their DMS to the sales platform, there is no need for manual double entry. Vehicle data is transferred automatically, condition reports are accessible centrally, and logistics can be tracked digitally. This not only saves time but also reduces errors in pricing.
Used electric vehicles deserve special attention here: In Q4 2025, their prices fell by about 5 percent compared with the previous year; in December 2025, a used electric car cost an average of 33,503 euros. Those with BEVs in their fleet need particularly close monitoring to avoid incurring losses in value.
How can the used-car margin in the B2B sector be optimized in the long term?
A few good deals aren't enough. Long-term margin protection requires systematic profit management across the entire team and the entire portfolio.
Link Compensation Structures to Gross Revenue
If buyers are compensated solely based on unit volume, they will purchase at inflated prices. If Seller focuses only on volume, it will sacrifice profit margins. Compensation must be tied to gross profit per vehicle, not to unit volume or sales revenue alone.
A simple model: base commission plus margin bonus. If the realized gross profit exceeds the target, the commission increases. If it falls short, the commission decreases. This instills a focus on margins throughout the entire team, from purchasing through processing to sales.
Product Line Strategy and Specialization as a Means of Protecting Margins
Not every vehicle is equally profitable. Auctions for dealers offer access to a wide range of vehicles, but that doesn't mean you should buy everything. Specializing in high-margin segments protects your profits better than operating a general-interest business.
Analyze your historical data: In which segments do you consistently achieve above-average gross margins? Where are inventory turnover rates high and holding periods short? Focus your capital there. A vehicle that sells in 25 days with an 8 percent net margin is more profitable than one that sits on the lot for 70 days and ultimately sells with a 12 percent gross margin.
It’s also helpful to look at used-car marketplaces to identify demand patterns across different segments and tailor the product lineup accordingly.
KPI Dashboard for Ongoing Margin Monitoring
You can't manage what you don't measure. Effective margin monitoring includes at least the following metrics:
Average Gross Margin per Vehicle (by Segment)
Average turnaround time (target: less than 45 days)
Recycling Costs per Vehicle (Target vs. Actual Comparison)
Transaction Rate: The percentage of listed vehicles that are actually sold
Capital Commitment Period: How long is capital tied up per vehicle?
On CarOnSale, the overall transaction rate in 2025 was 76 percent. This is an indicator of the speed of sales on the platform and is directly relevant to capital tied up: Vehicles that sell quickly free up capital for the next purchase.
BEVs require special attention in the KPI dashboard. In several European markets, three-year-old BEVs with 60,000 km retain a comparatively smaller portion of their original list price than internal combustion engine vehicles (Autovista Group). Dealers carrying BEVs in their lineup need shorter review cycles and more aggressive escalation rules for time on lot.
Frequently Asked Questions About Margin Calculation in the B2B Auto Trade
What is a realistic gross margin in the B2B used-car market?
In B2B retail, gross margins typically range from 5 to 15 percent of the selling price. Small cars with high turnover are at the upper end of the range (8 to 15 percent), while premium vehicles tend to be in the 5 to 10 percent range. The key factor is the net profit after all costs: a 15 percent gross margin often yields only 5 to 7 percent net profit after factoring in preparation costs, holding costs, and taxes.
Is dynamic pricing also worthwhile for smaller B2B retailers?
Yes, especially for smaller businesses. Anyone who sells 30 to 50 vehicles per month feels the impact of every bad purchase immediately. Data-driven pricing and rule-based pricing curves aren’t a matter of company size, but of process discipline. Even simple rules—such as automatically lowering the price after 30 days on the lot—measurably protect margins.
How is the shift toward electric vehicles affecting margins in the used-car market?
Used electric vehicles depreciate faster than internal combustion engine vehicles. The average depreciation rate after three years is 51 percent for BEVs, compared to 31 percent for internal combustion engine vehicles. This means that BEVs require shorter time on the lot, faster price adjustments, and more frequent monitoring. For dealers who carry BEVs in their used car sales, it is advisable to use a separate pricing strategy.
Which mistakes cost B2B retailers the most in terms of profit margin?
The three most costly mistakes: First, calculating costs without a full-cost approach (calculating only the purchase price minus the selling price). Second, excessively long downtime without escalation rules. Third, emotional pricing instead of data-driven market price determination. Each of these mistakes can cost between 200 and 500 euros per vehicle; when multiplied across the entire fleet, this results in a six-figure difference in revenue per year.
How can I reduce processing costs without compromising quality?
Standardized reconditioning packages with fixed budgets are the most effective tool. Define two to three tiers (Basis, Standard, Premium) with clear price caps. Vehicles that require reconditioning costs exceeding the budget are either screened out before purchase or sold on to wholesalers. This prevents individual vehicles from dragging down the average margin of the entire inventory.
Conclusion: Margin Calculation as a Strategic Competitive Advantage
The margin in B2B auto sales doesn’t happen by chance, and it isn’t generated only at the point of sale. It is secured at the time of purchase, influenced by reconditioning, and determined by the time the vehicle spends in inventory. Those who calculate all three phases using a full-cost approach, employ dynamic pricing, and define clear escalation rules for inventory turnover systematically protect their profits.
A summary of the key levers: data-driven purchasing decisions instead of gut feelings, segment-specific target margins instead of blanket figures, rule-based pricing curves instead of manual discounts, and a KPI dashboard that displays the margin per vehicle in real time.
In a market characterized by price volatility, regulatory pressure, and increasing transparency, cost accounting itself becomes a competitive advantage. Companies that fully digitize their processes and track the right metrics can identify margin losses before they occur. Higher profits, lower costs: This is no coincidence, but rather the result of disciplined cost accounting.


